Bare soil indicator
Federal Research Centre for Cultivated Plants
Institute for Crop and Soil Science
The joint project MonViA is working on the monitoring of biodiversity in agricultural landscapes in Germany. Earth observation satellites provide valuable information on land cover, land use and its changes. The bare soil indicator is one example of numerous remote sensing-based indicators developed in MonViA.
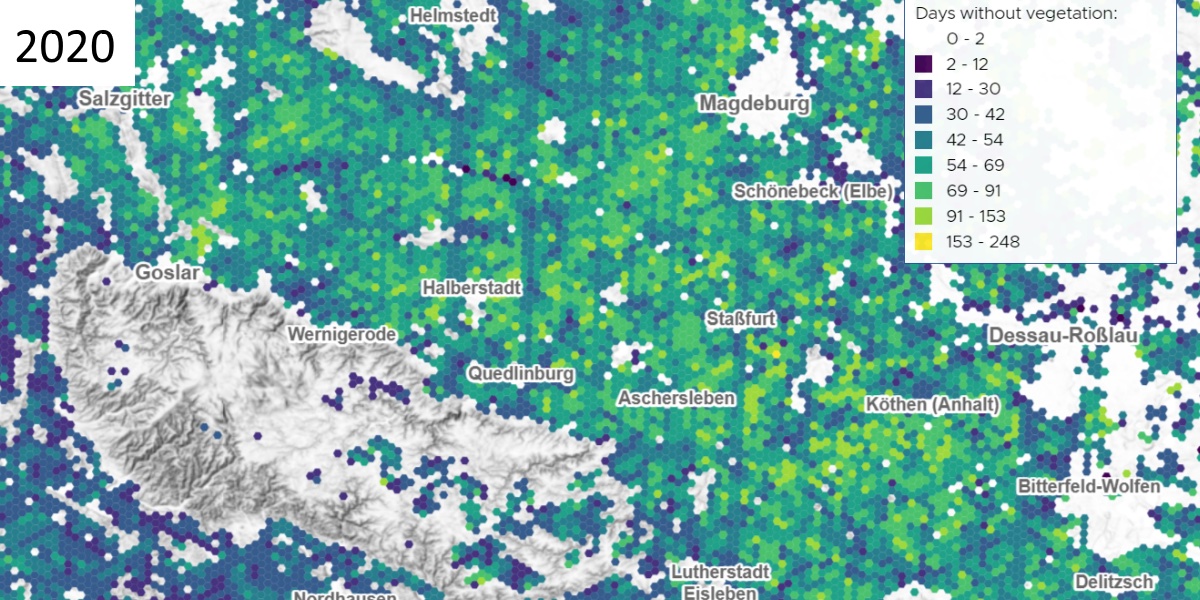
Number of days per year on which agricultural soils are uncovered, derived from Copernicus Sentinel-2 data
Year-round vegetation cover protects soils against wind and water erosion, promotes good soil structure and active soil life, reduces nutrient leaching and minimises water pollution.
The indicator provides information on the average number of days per year on which arable land is not covered by green vegetation or crop residues. Like all MonViA indicators, the data refer to a Germany-wide grid consisting of 1 km² large hexagons (see image section).
Analysis-ready Sentinel-2 data (S2_GermanyGrid, Beyer et al. 2023), which are generated Germany-wide on CODE-DE, and remote sensing-based crop type classifications (Blickendörffer et al. 2021) serve as the data basis. The crop type classification was used to identify arable land and spectral indices (Mzid et al. 2021) were calculated for the corresponding hexagons for the entire year.
The bare soil indicator shows spatial patterns of regionally common farming practices with regard to the range of crops, in particular the structural diversity of crop rotations. Regions with high indicator values (yellow) are areas with medium to high structural diversity (wide crop rotation). Regions with low values (blue) are dominated by low structural diversity, i.e. a low number of arable crops and crop rotation.
Further information
Further information on this product can also be found on the following external pages:
- MonViA project page: https://www.agrarmonitoring-monvia.de/
- Online JKI MAP-Viewer mit den Layern: https://sf.julius-kuehn.de/mapviewer/monviafs
- Analysefertige Sentinel-2-Daten: Beyer, F., Brandt, P., Schmidt, M., Stahl, U., Golla, B., Gerighausen, H., & Möller, M. (2023). A paradigm shift towards decentralized cloud-integrated spatial datainfrastructures: Lessons learned and solutions provided for public authorities (preprint). Eartharxiv.Org, 1–33: https://doi.org/10.31223/X53H3N
- Indizes und Schwellwerte: Mzid, N., Pignatti, S., Huang, W., & Casa, R. (2021). An Analysis of Bare Soil Occurrence in Arable Croplands for Remote Sensing Topsoil Applications. Remote Sensing, 13(3), 474.: https://doi.org/10.3390/rs13030474
- Fruchtartenklassifikationen: Blickensdörfer, L., Schwieder, M., Pflugmacher, D., Nendel, C., Erasmi, S., & Hostert, P. (2021). National-scale crop type maps for Germany from combined time series of Sentinel-1, Sentinel-2 and Landsat 8 data (2017, 2018 and 2019). Zenodo Data Puiblication: https://doi.org/10.5281/zenodo.5153046
Image source
©️ Florian Beyer, Heike Gerighausen, Julius-Kuehn-Institut.
Projekt MonViA