Flood Inundation Mapping
Landesamt für Vermessung und Geoinformation Schleswig-Holstein
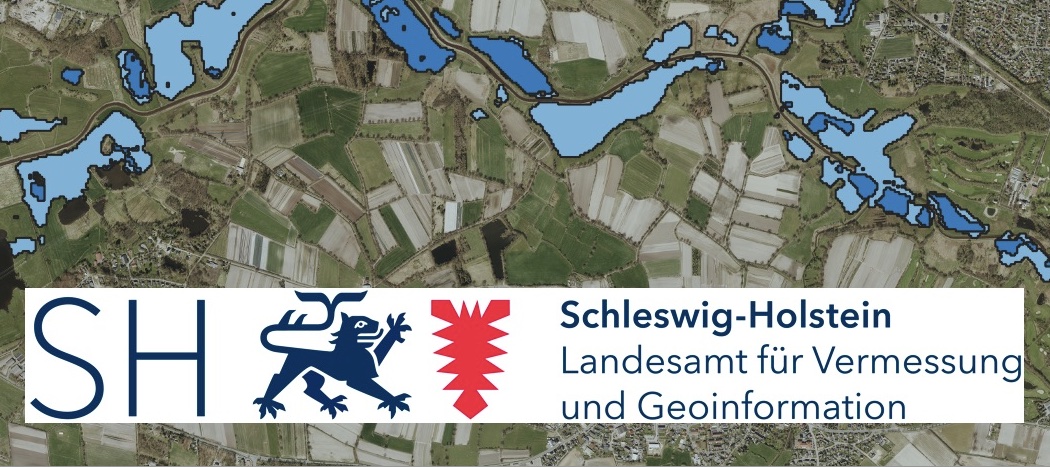
Flooding caused by heavy rainfall events, prolonged periods of rain or storm surges is an increasing problem in Germany. Sentinel-1 radar data is used by LVermGeo SH to detect flooded areas and can thus support disaster control, rescue services and planning authorities.
Methodology
Due to the low backscattering of water surfaces in the radar range and the independence of weather and time of day, radar data is very suitable for water detection. However, due to the system, water-saturated meadows and fields or wet tarmac also have similar properties like water surfaces for radar. This can lead to misclassifications during automatic detection. In order to minimise or exclude such effects, the water areas previously classified from Sentinel-1 (S1) data are blended and qualified with other official geodata (digital terrain model (DTM) and ATKIS data) and soil moisture data derived from Sentinel-1.
The radar data is processed automatically on CODE-DE. The required Sentinel-1 Interferometric Wide (IW) swath data in VV and VH polarisation are first pre-processed in order to obtain calibrated and geocoded intensity data in 10 m spatial resolution for the subsequent work steps. Subsequently, an unsupervised k-means classification is performed.
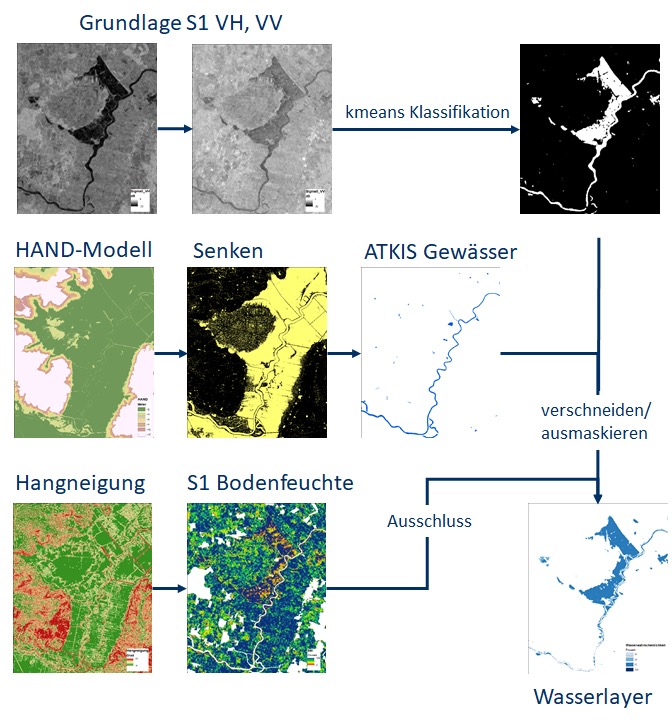
Figure 1: Overview of the various input data and the correction of the classification. In the course of the correction, pixels on which it is topographically unlikely that there is water coverage are excluded.
The HAND model (Height Above the Nearest Drainage) is first calculated from the LVermGeo SH DTM. The HAND algorithm normalises the topography by setting the heights of a catchment area relative to the drainage. With the help of this HAND model, higher areas above the nearest drainage are masked. In addition, the slopes and depressions are calculated from the DTM; slopes above 3° are also masked out.
In order to further check the plausibility of the classification results obtained and to minimise possible misclassifications, the relative soil moisture is determined from the S1 intensity data using the TU Vienna method. To do this, the driest and wettest conditions in a time series must be known. By linear scaling between these driest and wettest references, the relative soil moisture can be estimated for a specific point in time. Areas with a soil moisture content below 60 % are considered too dry and are masked out.
The remaining areas, depressions and ATKIS water bodies are summarised to create a probability grid. This is blended with the previously performed classification to indicate the percentage probability of water cover. To show only flooded temporary water areas, the geodata is used over land areas to mask out rivers and lakes. The result is a percentage reliability of flooded areas given in 33%, 66% or 100%.
CODE-DE is very well suited for an automated process chain due to the availability of Sentinel-1 data and computing capacity. Due to the failure of the Sentinel-1b satellite at the end of 2021, data can currently only be provided every 12 days. With the launch of Sentinel-1c, however, it will hopefully be possible to increase the timeliness to six days again.
Further information
- Digitaler Atlas Nord: https://danord.gdi-sh.de/view/copernicus
Further illustrations
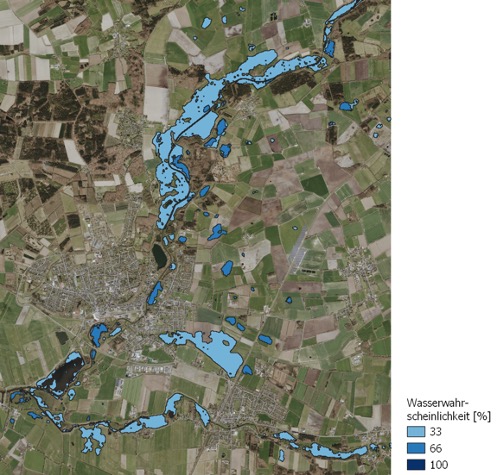
Figure 2: Flood Kellinghusen on 21.02.2021. Contains modified Copernicus Sentinel data (2021), processed by LVermGeo SH. Background DOP 2022 ©GeoBasis-DE/LVermGeo SH/CC BY 4.0
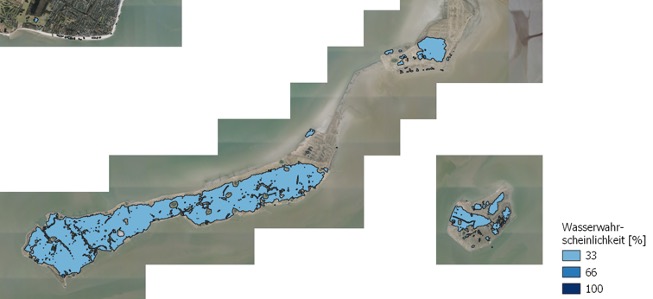
Figure 3: Storm surge Langeneß; 25.12.2023. Contains modified Copernicus Sentinel data (2021), processed by LVermGeo SH. Background DOP 2022 ©GeoBasis-DE/LVermGeo SH/CC BY 4.0
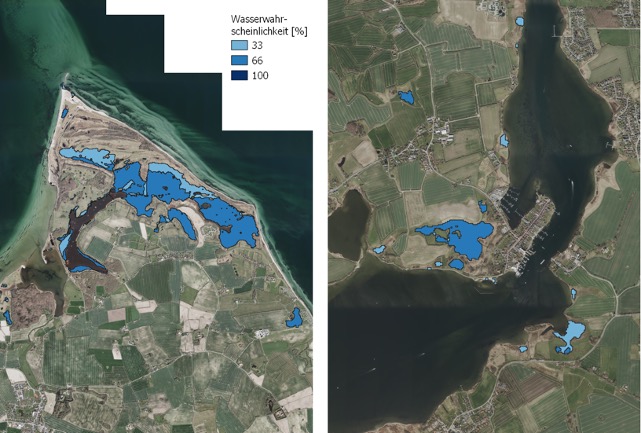
Figure 4: Storm surge Baltic Sea coast. Geltinger Birk (left) and Arnis (right) 21.10.2023. Contains modified Copernicus Sentinel data (2021), processed by LVermGeo SH. Background DOP 2022 ©GeoBasis-DE/LVermGeo SH/CC BY 4.0